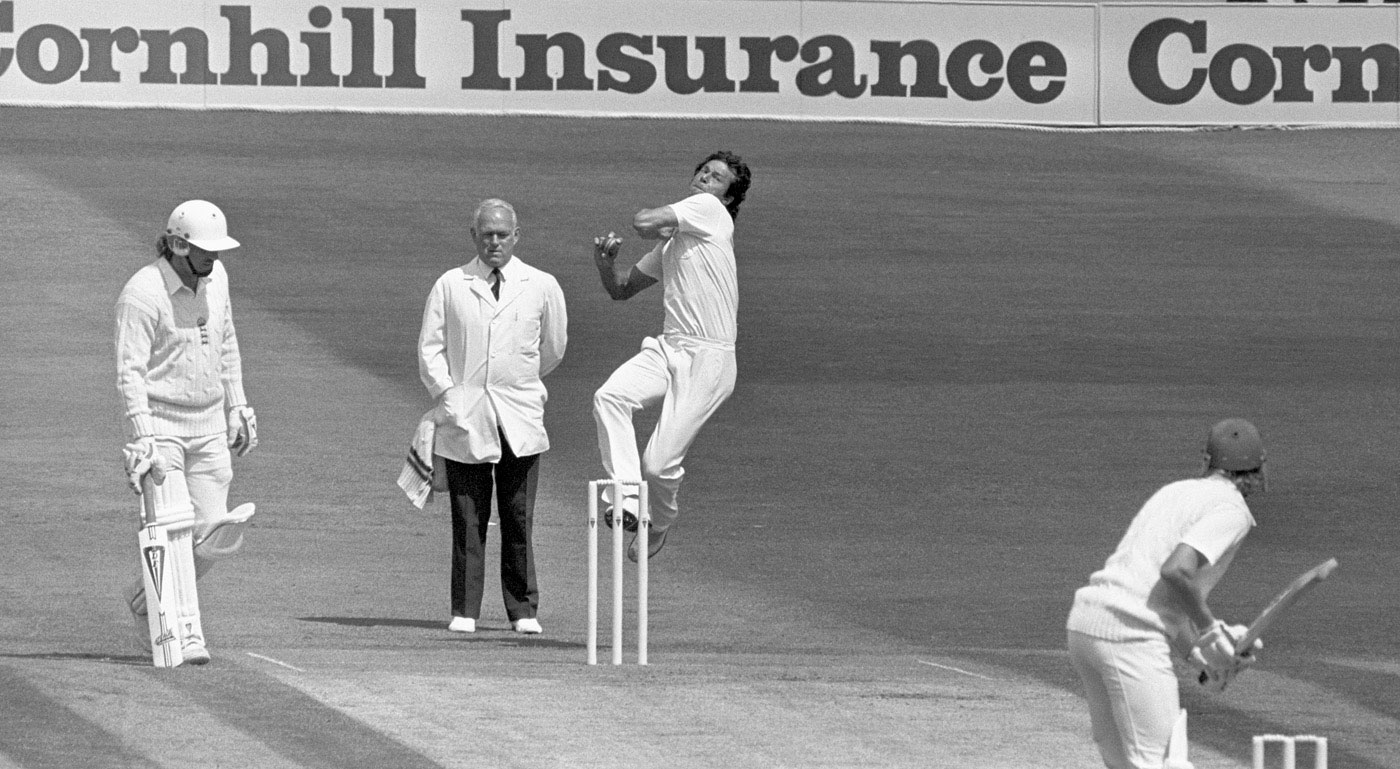
Thirty-three's the charm: Imran Khan took 171 wickets in his best 33 Tests


Thirty-three's the charm: Imran Khan took 171 wickets in his best 33 Tests
Four number crunchers present four above-average options
Peak-33
By Andy Zaltzman
How good was Ian Botham? Overall he averaged 28.40 with the ball, 33.54 with the bat. In the first 25 Tests of his 102-Test career, those figures are 18.52 and 40.48; in the final 25, 42.00 bowling, 23.45 batting. Overall-Botham was very good. Late-slump-Botham, scuttled by injury and time, did not merit selection. Peak-Botham was one of the greatest Test cricketers of all time. Peak-Waqar took 19 five-fors in his first 31 Tests; Increasing-Back-Trouble-Waqar took only three more in his final 56 games.
Cricket needs a measure of how good a player was in his best years. There are, evidently, greater priorities on this often-malfunctioning planet, and in this often-malfunctioning sport, but the career average, at best, needs considerable prodding to reveal its truths, and, at worst, is wilfully misleading. I therefore unveil: Peak-33 - a player's numbers in the best 33-Test phase of their careers.
Peak-33 is based on the 33 matches in which batsmen scored most runs and bowlers took most wickets, rather than the 33 in which they returned the best average.
I could have chosen another mathematically convenient number: Peak-50, for example, the length of the high plateau period of Donald Bradman's Test career; in other words, his entire career excluding his debut (18 and 1), and his final-Test duck. I could have chosen Peak-25, the number of Tests in which SF Barnes bowled a significant number of overs during his legendary 189-wickets-at-16 England career. While no one has come close to Barnes' career average since then - an average itself skewed by a deluge of late-career wickets against a relatively underpowered South Africa - Imran Khan's Peak-25 (from 1981 to 1986, excluding two Tests in Australia in which he did not bowl due to injury) produced 154 wickets at 14.85. Or I could have chosen Peak-200, to appeal to the Tendulkar fans.
I chose Peak-33, however, for the following reasons:
1. It is long enough to require prolonged consistency, even in the modern age of hyper-hectic golden-goose-squeezing schedules.
2. It is short enough to encompass the careers of far more of the pre-war titans of cricket than Peak-50.
3. It sounds better.
4. It could be the sequel to Catch-22.
5. It is the length of the Test career of naughty, naughty Salman Butt, who, with an average of 30.46, does not emerge well from the statistic.
6. It is the atomic number of arsenic. (Thank you, Wikipedia.)
7. It is the number of vertebrae in the normal human spine (coccyx included). (Ditto.)
8. It was the average number of different mystery balls announced by Shane Warne before an Ashes series. If I remember correctly.
9. It is the number of tracer bullets fired by Ravi Shastri in his special commentary research laboratory, in order to ascertain the average speed of a tracer bullet, against which to compare the speed of cricket balls.
I admit that Peak-33 is, at best, in the pre-alpha stage of its development as a statistical measure. It needs to take into account comparative contemporary scoring trends - early 21st-century batsmen predominate - as well as opposition and context. Some interesting candidates emerge, however, in particular Peak-Imran-Khan, whose best outdoes everyone by a considerable margin, and Peak-Jack-Hobbs, whose 1910-1925 average of 65.22 was 20 runs an innings ahead of any Peak-33 achieved at the time.
Perhaps a peak measurement needs to involve some combination of time period, number of matches, and proportion of a player's career, as well as factoring in the impact of a player's performances, rather than the mere quantity of his runs and wickets.
Here, nonetheless, to start the conversation - a conversation which I will in all likelihood be having only with myself - are the top ten Peak-33 players, based on their averages in the matches in which they scored most runs or took most wickets.
| Player | Team | Start date | Runs | Average | 100s | 50s |
| Don Bradman | Aus | 1928-12-29 | 4835 | 102.87 | 19 | 8 |
| Viv Richards | WI | 1976-01-03 | 3483 | 72.56 | 12 | 15 |
| Rahul Dravid | Ind | 2002-04-11 | 3329 | 72.37 | 11 | 12 |
| Steve Waugh | Aus | 1993-11-26 | 2876 | 71.90 | 9 | 16 |
| Mahela Jayawardene | SL | 2006-07-27 | 3785 | 71.42 | 14 | 9 |
| AB de Villiers | SA | 2010-06-10 | 3209 | 71.31 | 10 | 14 |
| Wally Hammond | Eng | 1928-06-23 | 3410 | 71.04 | 13 | 9 |
| Garry Sobers | WI | 1957-08-22 | 3481 | 71.04 | 14 | 9 |
| Sachin Tendulkar | Ind | 1997-12-03 | 3650 | 70.19 | 15 | 12 |
| Jacques Kallis | SA | 2003-09-04 | 3438 | 70.16 | 13 | 15 |
| Player | Team | Start date | Wickets | Average | 5wi | 10wm |
| Imran Khan | Pak | 1980-01-29 | 171 | 15.90 | 12 | 3 |
| Muttiah Muralitharan | SL | 2003-06-20 | 250 | 17.32 | 23 | 9 |
| Johnny Briggs | Eng | 1884-12-12 | 118 | 17.75 | 9 | 4 |
| Malcolm Marshall | WI | 1984-03-30 | 196 | 17.65 | 15 | 3 |
| Jim Laker | Eng | 1951-07-05 | 146 | 17.73 | 7 | 3 |
| Richard Hadlee | NZ | 1982-03-12 | 196 | 18.47 | 18 | 4 |
| Curtly Ambrose | WI | 1990-03-23 | 164 | 18.84 | 10 | 3 |
| Shaun Pollock | SA | 1997-10-24 | 153 | 19.31 | 9 | 0 |
| Alan Davidson | Aus | 1956-10-26 | 171 | 19.39 | 14 | 2 |
| Waqar Younis | Pak | 1990-10-18 | 191 | 19.56 | 19 | 4 |
Andy Zaltzman is a stand-up comedian, a regular on BBC Radio 4, and a writer
****
Weighted Wicket Probability
By Phil Oliver
Wahab went wicketless in a testing five-over spell in the Lord's Test, but how dangerous was he and how did it impact the match result?
© Getty Images

Cricket is a game of statistics. Every delivery is an event in itself, full of information that can be used to measure player performance - so many variables, so much data. It is for this reason that providing the best possible context and finding the most significant statistics is not easy. We look at scorecards, series averages and career records, wondering who has produced the best performances. Traditional measures can go some way in making these comparisons, but the application of analytics adds the necessary context.
Cricket fans know that the top scorers and wicket-takers in a match have not necessarily performed the best. CricViz's analysis of ball-tracking data allows the quality of each delivery to be measured, enabling more precise evaluation and comparison. That enables the calculation of a Weighted Wicket Probability (WWP) for every ball.
From live ball-tracking feeds, CricViz evaluates each delivery based on six criteria: line, length, bounce, speed, movement in the air and movement off the pitch. We conduct a nearest-neighbour analysis, examining the runs and wickets associated with the 1000 most similar balls in our database based on these criteria.
If the 1000 near-identical deliveries in the database took ten wickets, then the ball in question would take a wicket 1% of the time. This allows the measurement of the most threatening bowlers, spells and sessions. For example, James Anderson's superiority in England's innings-and-88-run victory over Sri Lanka at Headingley this summer was highlighted by his WWP. Anderson's mastery of seam and swing saw him take ten wickets in the match, with an average WWP of 2.13% per ball (meaning his average delivery would take a wicket 2.13% of the time he bowled it). For context, Sri Lanka's bowlers had an average WWP of 1.38% per delivery.
However, the significance of this statistic is that it can offer deeper insight than scorecards and other traditional measures can: the instances where bowlers go unrewarded, the wicketless spells that deserved more or built pressure for team-mates. Wahab Riaz's second spell on day four of Pakistan's win at Lord's in July was one such passage of play.
England were edging towards their target when Wahab returned for a five-over burst. It was a riveting 45 minutes. Jonny Bairstow and Chris Woakes battled hard to repel Wahab's pace and reverse swing. That they succeeded was testament to their skill and concentration, but it was also due to a healthy dose of luck. Wahab's spell read 5-1-8-0, but his repeated beating of the bat meant his WWP was 2.14% per ball in those five overs. In other words he was more threatening than Anderson was in his ten-wicket Headingley masterclass.
In England's second innings as a whole, Wahab's WWP was 1.88%, compared with Yasir Shah's 1.35%, Mohammad Amir's 1.22% and Rahat Ali's 1.05%. He took just one wicket but that was not the significant statistic. WWP is made even more powerful when combined with weighted runs. If the 1000 near-identical balls in the analysis went for 400 runs and took ten wickets, the ball in question would average 40. This would be an easier ball to face than we would expect, based on the career averages of most front-line bowlers.
| Bowler | Lord's | Old Trafford | Edgbaston | The Oval |
| Mohammad Amir | 1.18 | 1.38 | 1.18 | 1.57 |
| Wahab Riaz | 1.67 | 1.53 | 1.51 | |
| Yasir Shah | 1.34 | 1.22 | 1.10 | 1.07 |
| Sohail Khan | 1.37 | 1.28 | ||
| Rahat Ali | 1.19 | 1.30 | 1.34 | Chris Woakes | 1.66 | 1.46 | 1.64 | 1.63 |
| Stuart Broad | 1.42 | 1.56 | 1.45 | 1.39 |
| James Anderson | 1.64 | 1.76 | 1.54 | |
| Ben Stokes | 1.66 | |||
| Steven Finn | 1.33 | 1.47 | 1.59 | |
| Jake Ball | 1.33 | |||
| Moeen Ali | 1.20 | 1.07 | 1.02 | 0.98 |
This analysis of ball-tracking data allows for deeper analysis of batting. We can categorise how hard the bowling actually was to face, and not just make judgements based on career records and reputation. Significant statistics inform, prompt debate and contextualise performances. They are often used by fans to make a point, so next time you are discussing unlucky bowlers, perhaps reference to WWP can help.
Phil Oliver is managing editor and co-founder of the cricket analytics app CricViz
****
Batting/Bowling Score based on adjusted average and adjusted strike rate/economy rate
By S Rajesh
Viv Richards was streets ahead of his time in one-day cricket
© PA Photos

When evaluating batting or bowling performances in limited-overs cricket, the rate of scoring or conceding runs plays as big a role as the number of runs scored or wickets taken. Conventional cricket stats measure the two separately, by way of averages and strike/economy rates. Ideally you'd want the batsmen to have high averages and strike rates, and bowlers to have low averages and economy rates, but it becomes difficult to directly compare a Virender Sehwag (ODI average 35.05, strike rate 104.33) with a Michael Bevan (average 53.58, strike rate 74.16).
A relatively easy and intuitive way to combine the two factors is to multiply the average by the number of runs scored per ball (strike rate divided by 100). For bowlers, multiply the average by the runs conceded per ball (economy rate divided by six). The higher the product, the better for batsmen, while the opposite holds true for bowlers. Doing this for Sehwag and Bevan, we get 36.57 for Sehwag, and 39.73 for Bevan, which is probably a fair estimate of their abilities.
However, there is also the small matter of the changing tempo of the ODI game, and of different scoring rates in different parts of the world. In the 1980s, the average strike rate was 66.52; in the 2010s it is 81.39: an increase of 22%. Since 2000, the average ODI strike rate in India has been 84.34, while in the West Indies it is 74.50. The runs-per-dismissal numbers have changed too, with an 11% increase in the 2010s from the 1980s. To compare batsmen and bowlers meaningfully across eras in limited-overs cricket, it is necessary to take as a benchmark the par performances of that era and, to eliminate the difference in conditions between, say, England and India within the same era, the par performances in the matches the player played.
The Batting Score is the product of the average and strike-rate factors, both of which are adjusted to reflect how much better (or worse) the player is than the mean, in the matches he played in. Sachin Tendulkar, for example, had a career average and strike rate of 44.83 and 86.23 in ODIs, and in the matches he played, the overall batting average and strike rate were 29.93 and 76.45. This means Tendulkar's average was better by a factor of 1.50, and his strike rate by a factor of 1.13. The product of the two, multiplied by 100, gives the Batting Score. (To make the method even more accurate, you could exclude the player's stats when calculating the overall batting and bowling averages.)
This adjustment allows us to compare batsmen and bowlers across eras. The table below shows just how far ahead of everyone else Viv Richards is: his Batting Score is 248.19, while AB de Villiers is the only other batsman with a 200-plus score. Richards' greatness was that he produced numbers that are exceptional even by 2010s standards, despite playing in an era when the benchmarks were far lower: his average was 1.78 times the norm, and his strike rate 1.40 times better. The table also illustrates why Dean Jones was so highly rated as an ODI batsman.
| Batsman | Average | Strike rate | Average factor | Strike rate factor | Batting score |
| Viv Richards | 47 | 90.20 | 1.78 | 1.40 | 248.19 |
| AB de Villiers | 53.63 | 99.87 | 1.76 | 1.20 | 212.42 |
| Michael Bevan | 53.58 | 74.16 | 1.87 | 1.01 | 188.72 |
| Dean Jones | 44.61 | 72.56 | 1.69 | 1.09 | 183.64 |
| MS Dhoni | 51.25 | 89.27 | 1.61 | 1.06 | 169.89 |
| Sachin Tendulkar | 44.83 | 86.23 | 1.50 | 1.13 | 168.94 |
| Adam Gilchrist | 35.89 | 96.94 | 1.23 | 1.26 | 155.69 |
| Kumar Sangakkara | 41.98 | 78.86 | 1.51 | 1.02 | 154.48 |
| Ricky Ponting | 42.03 | 80.39 | 1.46 | 1.04 | 151.70 |
| Virender Sehwag | 35.05 | 104.33 | 1.15 | 1.29 | 148.30 |
A similar exercise works for bowlers as well, replacing strike rate with economy rate. In the 98 ODIs that Joel Garner played, for instance, the overall bowling average was 29.66, and the overall economy rate 3.91, compared to his own average of 18.84 and economy rate of 3.09. His average was thus 1.57 times better, and his economy rate 1.27 times better than the overall mean. The product of those two factors, multiplied by 100, gives him a Bowling Score of 199.21. The table below has the corresponding numbers for some of the other leading ODI bowlers, and Garner is clearly the best of the lot, followed by Glenn McGrath, Shaun Pollock and Muttiah Muralitharan.
An added advantage is the ability to compare batsmen with bowlers, through their overall Batting/Bowling Scores, which tells us how much better they were than the average performers in the matches they played in.
| Bowler | Average | Economy rate | Average factor | Econ rate factor | Bowling score |
| Joel Garner | 18.84 | 3.09 | 1.57 | 1.27 | 199.21 |
| Glenn McGrath | 22.02 | 3.88 | 1.50 | 1.21 | 181.31 |
| Shaun Pollock | 24.5 | 3.67 | 1.35 | 1.27 | 171.3 |
| Muttiah Muralitharan | 23.08 | 3.93 | 1.39 | 1.18 | 163.45 |
| Michael Holding | 21.36 | 3.32 | 1.37 | 1.18 | 162.18 |
| Shane Bond | 20.88 | 4.28 | 1.42 | 1.09 | 154.84 |
| Richard Hadlee | 21.56 | 3.3 | 1.29 | 1.18 | 152.60 |
| Curtly Ambrose | 24.12 | 3.48 | 1.25 | 1.21 | 151.52 |
| Wasim Akram | 23.52 | 3.89 | 1.31 | 1.12 | 146.87 |
| Waqar Younis | 23.84 | 4.68 | 1.28 | 0.95 | 122.4 |
S Rajesh is stats editor of ESPNcricinfo
****
Strike Rate Ratio
By Kartikeya Date
How do you compare the bowling careers of Andy Roberts and Jason Gillespie, both of whom averaged 26 with a strike rate of 55?
© Getty Images

Only three things are counted in cricket: deliveries, runs and wickets. The two most common measurements - batting average and bowling average - measure the runs scored per dismissal and the runs conceded per wicket. The limited-overs game has brought with it strike-rate and economy-rate measures - runs scored per 100 deliveries, and runs conceded per over. These measures have endured and even describe thresholds of greatness in some cases - a batting average above 50, or a bowling average below 25. The strike rate for bowlers is calculated as the number of balls bowled per wicket.
All these conventional measures consider players individually. To consider players against specific opponents, one has to calculate these measures for games against those opponents. Here I propose a measure which considers a player relative to team-mates. For example, while Jason Gillespie and Andy Roberts ended their careers with near-identical bowling averages and strike rates (average 26, strike rate 55), what does this tell us about their roles in their respective sides?
The Strike Rate Ratio (SRR) is a measure of the bowler's strike rate to that of all the other bowlers in the team. Over a career, this measure adds richness to a bowler's record by comparing it to an average team-mate in identical bowling conditions.
A few intuitions about the SRR are possible. For specialist fast bowlers, the ratio should be well below 1. For specialist spinners, it is likely to be above 1. Fast bowlers get wickets more frequently than spinners. Further, for strong bowling attacks, the ratio for all bowlers should be close to 1 on either side.
Of the 67 bowlers* who have taken at least 200 Test wickets, 49 are pace bowlers, 17 are spinners and one is Garry Sobers. Five out of the 17 spinners have an SRR below 1. Seven out of the 48 pacers have an SRR above 1.
| Player | Career wickets | Strike rate | Strike rate at other end | Strike rate ratio |
| Richard Hadlee | 431 | 50.9 | 79.8 | 0.64 |
| Dale Steyn | 416 | 41.4 | 60.6 | 0.68 |
| Fred Trueman | 307 | 49.4 | 69.2 | 0.71 |
| Alan Donald | 330 | 47.0 | 65.7 | 0.72 |
| Chris Cairns | 218 | 53.7 | 73.8 | 0.73 |
| Darren Gough | 229 | 51.6 | 70.7 | 0.73 |
| Waqar Younis | 373 | 43.5 | 59.0 | 0.74 |
| Imran Khan | 362 | 53.8 | 70.7 | 0.76 |
| Bob Willis | 325 | 53.4 | 69.4 | 0.77 |
| Heath Streak | 216 | 62.8 | 79.8 | 0.79 |
| Kapil Dev | 434 | 63.9 | 81.2 | 0.79 |
| Jeff Thomson | 200 | 52.7 | 81.2 | 0.79 |
| Muttiah Muralitharan | 800 | 55.0 | 69.2 | 0.80 |
| Malcolm Marshall | 376 | 46.8 | 58.7 | 0.80 |
| John Snow | 202 | 59.5 | 74.6 | 0.80 |
| Bhagwath Chandrasekhar | 242 | 66.0 | 82.6 | 0.80 |
| Ian Botham | 383 | 57.0 | 70.9 | 0.80 |
| Dennis Lillee | 355 | 52.0 | 64.1 | 0.81 |
| Craig McDermott | 291 | 57.0 | 69.5 | 0.82 |
| Andy Caddick | 234 | 57.9 | 69.2 | 0.84 |
| Clarrie Grimmett | 216 | 66.9 | 79.5 | 0.84 |
| Michael Holding | 249 | 50.9 | 60.5 | 0.84 |
| Mitchell Johnson | 313 | 51.1 | 60.0 | 0.85 |
| Chris Martin | 233 | 60.2 | 70.4 | 0.86 |
| Andy Roberts | 202 | 55.1 | 63.8 | 0.86 |
| Graham McKenzie | 246 | 71.9 | 82.9 | 0.87 |
| Ray Lindwall | 228 | 59.9 | 69.0 | 0.87 |
| Alec Bedser | 236 | 67.4 | 77.6 | 0.87 |
| Makhaya Ntini | 390 | 53.4 | 60.9 | 0.88 |
| Merv Hughes | 212 | 57.9 | 66.0 | 0.88 |
| Javagal Srinath | 236 | 64.0 | 72.4 | 0.88 |
| Curtly Ambrose | 405 | 54.6 | 60.7 | 0.90 |
| Zaheer Khan | 311 | 60.4 | 67.0 | 0.90 |
| Joel Garner | 259 | 50.8 | 55.9 | 0.91 |
| Stuart MacGill | 208 | 54.0 | 59.4 | 0.91 |
| Wasim Akram | 414 | 54.7 | 59.2 | 0.92 |
| Matthew Hoggard | 248 | 56.1 | 60.2 | 0.93 |
| Stuart Broad | 358 | 56.8 | 60.9 | 0.93 |
| Brian Statham | 252 | 63.7 | 68.3 | 0.93 |
| James Anderson | 463 | 56.9 | 60.9 | 0.93 |
| Anil Kumble | 619 | 66.0 | 69.8 | 0.95 |
| Courtney Walsh | 519 | 57.8 | 61.0 | 0.95 |
| Shaun Pollock | 421 | 57.8 | 61.0 | 0.95 |
| Brett Lee | 310 | 53.3 | 55.8 | 0.96 |
| Glenn McGrath | 563 | 52.0 | 53.7 | 0.97 |
| Rangana Herath | 332 | 62.1 | 62.4 | 1.00 |
| Steve Harmison | 226 | 59.2 | 59.2 | 1.00 |
| Morne Morkel | 242 | 56.4 | 56.0 | 1.01 |
| Graeme Swann | 255 | 60.2 | 59.1 | 1.02 |
| Richie Benaud | 248 | 77.0 | 75.2 | 1.02 |
| Ishant Sharma | 209 | 66.6 | 64.7 | 1.03 |
| Chaminda Vaas | 355 | 66.0 | 64.0 | 1.03 |
| Peter Siddle | 208 | 61.1 | 59.3 | 1.03 |
| Shane Warne | 708 | 57.5 | 55.7 | 1.03 |
| Jason Gillespie | 259 | 55.0 | 53.0 | 1.04 |
| Andrew Flintoff | 226 | 66.2 | 62.9 | 1.05 |
| Harbhajan Singh | 417 | 68.5 | 63.6 | 1.08 |
| Bishan Bedi | 266 | 80.3 | 74.1 | 1.08 |
| Derek Underwood | 297 | 73.6 | 67.0 | 1.10 |
| Abdul Qadir | 236 | 72.6 | 65.0 | 1.12 |
| Saqlain Mushtaq | 208 | 67.6 | 59.5 | 1.14 |
| Danish Kaneria | 261 | 67.8 | 59.3 | 1.14 |
| Nathan Lyon | 211 | 62.4 | 53.9 | 1.16 |
| Garry Sobers | 235 | 91.9 | 78.9 | 1.17 |
| Lance Gibbs | 309 | 87.8 | 73.4 | 1.20 |
| Jacques Kallis | 292 | 69.3 | 56.9 | 1.22 |
| Daniel Vettori | 362 | 79.6 | 64.0 | 1.24 |
Morne Morkel, Ishant Sharma, Chaminda Vaas, Peter Siddle, Jason Gillespie, Andrew Flintoff and Jacques Kallis all have an SRR above 1. Gillespie's SRR is 1.04, while Roberts has an SRR of 0.86 over his career. The bowlers at the other end for Australia in Tests that Gillespie played took their wickets at the rate of one every 53 balls. Over the course of his career, Roberts' team-mates managed a wicket every 64 balls. This gives you an overall sense of the teams that Gillespie and Roberts played in. Seen alongside a bowler's individual strike rate, SRR presents a rich picture of what opponents were up against.
Richard Hadlee ended his career with a strike rate ratio of 0.64. In other words, he bowled only 64% of the deliveries needed at the other end for each wicket. His superb career strike rate of a wicket every 51 balls came in a New Zealand side in which bowlers at the other end required 80 balls for each wicket. Hadlee, Dale Steyn, Fred Trueman, Allan Donald, Chris Cairns and Waqar Younis all have a career SRR under 0.75. In Cairns' case it reflected the overall modesty of the bowling of the New Zealand teams he played in. The others were classical strike bowlers in relatively strong attacks.
Unsurprisingly, Hadlee is followed in the all-time list by strike bowlers. Steyn, Trueman, Waqar all have a career SRR below 0.75. Kapil Dev took his wickets at the rate of one every 64 balls, but his career SRR is 0.79. Imran Khan's career strike rate of 53.7 is accompanied by an SRR of 0.76.
Among the spinners, Bhagwath Chandrasekhar, Clarrie Grimmett, Muttiah Muralitharan, Stuart MacGill and Anil Kumble, all have an SRR below 1. With the exception of MacGill, this should not be surprising, since the other four were the dominant wicket-takers in their teams and were not supported by a noted fast bowler for the most part. MacGill played 16 of his 44 Tests with Shane Warne. In these Tests, he took 82 wickets at the rate of one every 42 balls. In Tests where Warne was not present, MacGill's strike rate is 62. Given Australia's fast-bowling strength in this era, it is possible to conclude that MacGill's career SRR is due to the fact that he played an unusually high percentage of his Tests in conditions that favoured spinners.
At their best, statistics suggest explanations and improve judgement. They are not, as is often believed, the alternative to exercising judgement. With this in mind, statistics that measure players relative to their team would be significant additions to the current set of elementary cricket statistics.
*This was written before R Ashwin got to his 200th Test wicket
Kartikeya Date writes at A Cricketing View and tweets here
© ESPN Sports Media Ltd.


